Quick Answer: Calculate Your BMI Now
BMI = weight (kg) ÷ [height (cm) ÷ 100]²
According to the Office on Women's Health, a healthy BMI for women is 18.5 – 24.9. Want your result instantly without doing the maths?
Knowing your BMI is one of the fastest ways to check whether your weight falls within a healthy range for your height. While it is not the only number that matters, it is a widely recognised screening tool used by doctors worldwide. The National Institutes of Health considers BMI a useful starting point for assessing weight-related health risks.
This guide gives you complete BMI charts for women in kg and cm, explains how BMI shifts with age, and shows you when to look beyond BMI for a fuller picture of your health. If you prefer a quick number, use our free BMI calculator to get your result in seconds.
How to Calculate BMI in kg and cm
The Body Mass Index formula is straightforward:
BMI = weight (kg) ÷ [height (cm) ÷ 100]²
In other words, divide your weight in kilograms by the square of your height in metres. Here are two worked examples:
Example 1: 65 kg, 165 cm
- Convert height to metres: 165 ÷ 100 = 1.65 m
- Square the height: 1.65 × 1.65 = 2.7225
- Divide weight by squared height: 65 ÷ 2.7225 = 23.9
- Result: BMI 23.9 — healthy range
Example 2: 80 kg, 160 cm
- Convert height to metres: 160 ÷ 100 = 1.60 m
- Square the height: 1.60 × 1.60 = 2.56
- Divide weight by squared height: 80 ÷ 2.56 = 31.3
- Result: BMI 31.3 — obese class I
Do not feel like doing the maths? Use our BMI Calculator to get your result instantly.
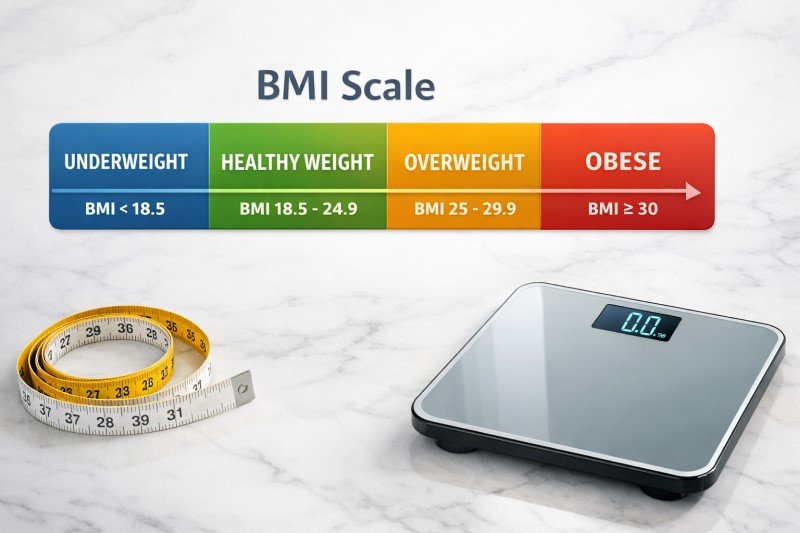
BMI Categories for Women
The World Health Organisation defines the following BMI categories. These apply to all adults, but the health implications can differ for women due to hormonal and body composition factors.
| BMI Range | Category | What It Means |
|---|---|---|
| Below 18.5 | Underweight | May indicate nutritional deficiency, hormonal issues, or high metabolism. Increased risk of osteoporosis and fertility problems. |
| 18.5 – 24.9 | Healthy weight | Associated with lowest health risks. Optimal range for most women of reproductive age. |
| 25.0 – 29.9 | Overweight | Moderately elevated risk for heart disease and type 2 diabetes. May be normal for muscular or athletic women. |
| 30.0 – 34.9 | Obese Class I | Significantly increased risk of metabolic syndrome, joint problems, and cardiovascular disease. |
| 35.0 – 39.9 | Obese Class II | High risk of obesity-related conditions. Medical guidance strongly recommended. |
| 40.0+ | Obese Class III | Very high health risk. Professional medical and nutritional support essential. |
BMI Chart for Women by Height (kg)
This is the main reference table. Find your height in the left column, then check which weight range you fall into. All weights are calculated using the BMI formula: weight = BMI × (height in metres)².
| Height | Underweight (<18.5) | Healthy (18.5–24.9) | Overweight (25–29.9) | Obese (30+) |
|---|---|---|---|---|
| 150 cm | Below 41.6 kg | 41.6 – 56.0 kg | 56.3 – 67.3 kg | Above 67.5 kg |
| 152 cm | Below 42.7 kg | 42.7 – 57.6 kg | 57.8 – 69.1 kg | Above 69.3 kg |
| 155 cm | Below 44.4 kg | 44.4 – 59.8 kg | 60.1 – 71.9 kg | Above 72.1 kg |
| 157 cm | Below 45.6 kg | 45.6 – 61.4 kg | 61.6 – 73.7 kg | Above 73.9 kg |
| 160 cm | Below 47.4 kg | 47.4 – 63.7 kg | 64.0 – 76.5 kg | Above 76.8 kg |
| 163 cm | Below 49.1 kg | 49.1 – 66.2 kg | 66.5 – 79.5 kg | Above 79.7 kg |
| 165 cm | Below 50.4 kg | 50.4 – 67.8 kg | 68.1 – 81.4 kg | Above 81.7 kg |
| 168 cm | Below 52.2 kg | 52.2 – 70.3 kg | 70.6 – 84.4 kg | Above 84.7 kg |
| 170 cm | Below 53.5 kg | 53.5 – 72.0 kg | 72.3 – 86.4 kg | Above 86.7 kg |
| 173 cm | Below 55.4 kg | 55.4 – 74.5 kg | 74.8 – 89.5 kg | Above 89.8 kg |
| 175 cm | Below 56.7 kg | 56.7 – 76.3 kg | 76.6 – 91.6 kg | Above 91.9 kg |
| 178 cm | Below 58.6 kg | 58.6 – 78.9 kg | 79.2 – 94.8 kg | Above 95.0 kg |
| 180 cm | Below 59.9 kg | 59.9 – 80.7 kg | 81.0 – 96.9 kg | Above 97.2 kg |
| 183 cm | Below 61.9 kg | 61.9 – 83.4 kg | 83.7 – 100.1 kg | Above 100.4 kg |
How to use this chart: Find your height, then locate the column that contains your current weight. If you are near a boundary, track your weight over a few weeks rather than relying on a single reading. For a personalised result, try our BMI Calculator.
BMI Chart in Feet and Pounds
Prefer imperial units? Here is the same data converted to feet, inches, and pounds for quick reference.
| Height | Underweight (<18.5) | Healthy (18.5–24.9) | Overweight (25–29.9) | Obese (30+) |
|---|---|---|---|---|
| 4'11" (150 cm) | Below 92 lbs | 92 – 123 lbs | 124 – 148 lbs | Above 149 lbs |
| 5'0" (152 cm) | Below 94 lbs | 94 – 127 lbs | 127 – 152 lbs | Above 153 lbs |
| 5'1" (155 cm) | Below 98 lbs | 98 – 132 lbs | 132 – 158 lbs | Above 159 lbs |
| 5'2" (157 cm) | Below 101 lbs | 101 – 135 lbs | 136 – 163 lbs | Above 163 lbs |
| 5'3" (160 cm) | Below 104 lbs | 104 – 140 lbs | 141 – 169 lbs | Above 169 lbs |
| 5'4" (163 cm) | Below 108 lbs | 108 – 146 lbs | 147 – 175 lbs | Above 176 lbs |
| 5'5" (165 cm) | Below 111 lbs | 111 – 150 lbs | 150 – 180 lbs | Above 180 lbs |
| 5'6" (168 cm) | Below 115 lbs | 115 – 155 lbs | 156 – 186 lbs | Above 187 lbs |
| 5'7" (170 cm) | Below 118 lbs | 118 – 159 lbs | 159 – 191 lbs | Above 191 lbs |
| 5'8" (173 cm) | Below 122 lbs | 122 – 164 lbs | 165 – 197 lbs | Above 198 lbs |
| 5'9" (175 cm) | Below 125 lbs | 125 – 168 lbs | 169 – 202 lbs | Above 203 lbs |
| 5'10" (178 cm) | Below 129 lbs | 129 – 174 lbs | 175 – 209 lbs | Above 209 lbs |
| 5'11" (180 cm) | Below 132 lbs | 132 – 178 lbs | 179 – 214 lbs | Above 214 lbs |
| 6'0" (183 cm) | Below 136 lbs | 136 – 184 lbs | 184 – 221 lbs | Above 221 lbs |
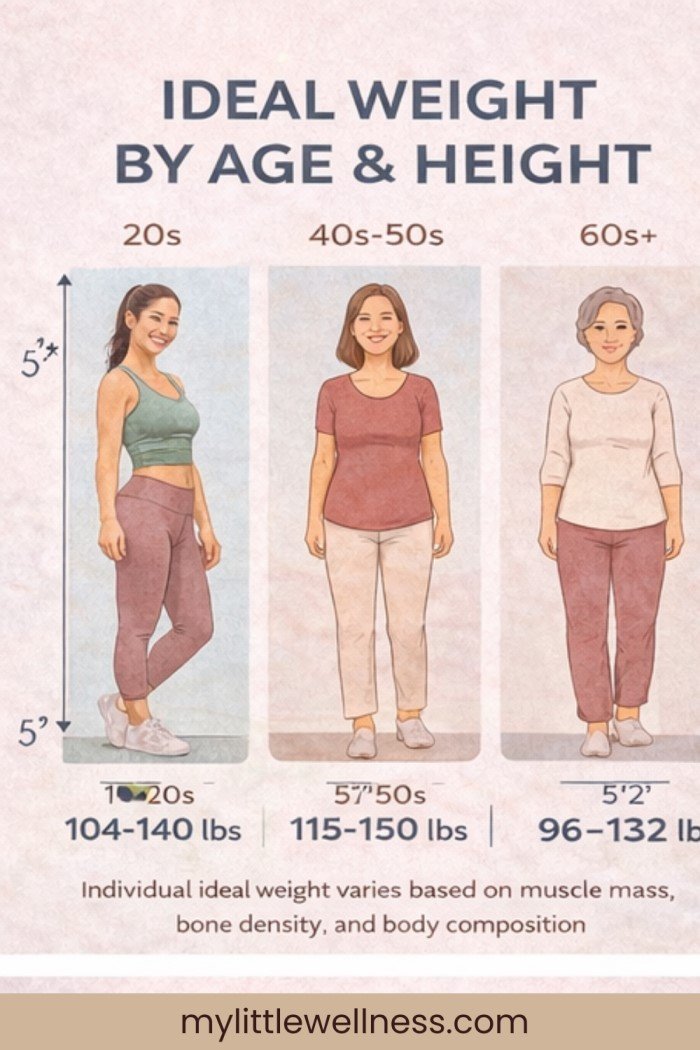
How BMI Changes with Age
While the BMI formula itself stays the same regardless of age, what constitutes a "healthy" BMI can shift as your body composition changes over the decades. Here is what to expect.
In Your 20s
Metabolism is typically at its highest, and muscle mass is easiest to build and maintain. Standard BMI ranges (18.5–24.9) apply well. This is a good time to establish baseline measurements and healthy habits. Most medical guidelines are calibrated for this age group.
In Your 30s
Metabolism slows by roughly 1–2% per decade. Pregnancy and postpartum recovery can temporarily shift BMI. If you are not strength training, you may notice gradual muscle loss being replaced by fat, even if the scale does not change much. A BMI that creeps from 22 to 24 is not automatically a concern.
In Your 40s
Perimenopause brings hormonal shifts that often redistribute fat to the midsection. Your BMI might stay the same while your waist circumference increases, which is why BMI alone becomes less informative at this stage. Prioritise strength training to preserve lean mass and consider tracking waist circumference alongside BMI.
In Your 50s and Beyond
After menopause, bone density and muscle mass decline more rapidly. Research published in the Journal of the American Geriatrics Society suggests that for women over 65, a BMI of 23–27 may actually be protective and associated with lower mortality than the standard 18.5–24.9 range. Unintentional weight loss in this age group is a red flag that warrants medical attention.
Age-Adjusted BMI Reference Table
| Age Group | Optimal BMI Range | Key Focus |
|---|---|---|
| 20–29 | 18.5 – 24.9 | Standard range applies; build healthy habits |
| 30–39 | 18.5 – 24.9 | Watch for gradual muscle loss; stay active |
| 40–49 | 19.0 – 25.5 | Track waist circumference; prioritise strength training |
| 50–59 | 20.0 – 26.0 | Maintain muscle and bone density; monitor body composition |
| 60–69 | 22.0 – 27.0 | Slightly higher BMI may be protective; avoid rapid weight loss |
| 70+ | 23.0 – 28.0 | Weight stability matters most; prevent unintentional loss |
BMI Limitations for Women
BMI is a useful screening tool, but it has well-documented limitations that are especially relevant for women.
Muscle Mass
BMI cannot distinguish between muscle and fat. Women who strength train regularly or have an athletic build may have a BMI of 26–28 while being perfectly healthy with low body fat. If your BMI is "overweight" but you exercise regularly and your waist circumference is normal, you are likely fine.
Pregnancy
BMI is not applicable during pregnancy. Weight gain during pregnancy is expected and healthy. Your pre-pregnancy BMI is used by healthcare providers to determine recommended weight gain during pregnancy, not your current BMI.
Ethnicity Differences
BMI thresholds were developed primarily from European-descent populations. Research shows that health risks may begin at lower BMI values for South Asian and East Asian women (BMI 23 rather than 25), and at higher values for some Black and Polynesian populations. The WHO has suggested lower cut-offs for Asian populations.
Fat Distribution
Two women with identical BMI can have very different health risk profiles depending on where they carry fat. Visceral fat (around organs in the abdomen) is far more dangerous than subcutaneous fat (under the skin on hips and thighs). BMI tells you nothing about fat distribution.
For a more complete picture of your body composition, try our Body Fat Calculator.
Beyond BMI: Other Metrics That Matter
BMI is a starting point, not the whole story. Here are additional measurements that give a fuller picture of your health.
Waist Circumference
Measure around your waist at the level of your belly button. For women, a waist circumference above 80 cm (31.5 inches) indicates increased health risk, and above 88 cm (35 inches) indicates substantially increased risk, regardless of BMI.
Waist-to-Hip Ratio
Divide your waist measurement by your hip measurement. For women, a ratio above 0.85 is associated with higher risk of cardiovascular disease and metabolic conditions. This metric is particularly useful because it accounts for body shape.
Body Fat Percentage
The most direct measure of body composition. Healthy body fat ranges for women are 21–31%, with athletes typically at 14–20%. Unlike BMI, body fat percentage distinguishes between lean mass and fat mass. Estimate yours with our Body Fat Calculator.
You may also find these resources helpful: Ideal Weight for Women by Age and Height and our Ideal Weight Calculator for personalised weight ranges based on multiple scientific formulas.
How to Improve Your BMI Healthily
Whether your BMI is above or below the healthy range, the goal should always be gradual, sustainable change rather than crash approaches.
If Your BMI Is Too High
- Create a modest calorie deficit: 300–500 calories below your daily calorie needs is enough for steady fat loss without muscle wasting
- Stay hydrated: Proper hydration supports metabolism and helps control appetite. Use our Water Intake Calculator to find your daily target
- Target belly fat specifically: Learn evidence-based strategies in our guide on how to lose lower belly fat
- Start a structured exercise plan: Our spring fitness plan for beginners is a great starting point if you are new to exercise
- Aim for 0.5–1 kg loss per week: Faster rates increase muscle loss and are harder to maintain
If Your BMI Is Too Low
- Eat in a modest surplus: 200–300 calories above your maintenance needs
- Focus on nutrient-dense foods: Nuts, avocados, whole grains, lean proteins, and healthy fats rather than empty calories
- Add strength training: To ensure gained weight is lean muscle rather than just fat
- Rule out medical causes: Unexplained low BMI may indicate thyroid issues, coeliac disease, or other conditions
- Be patient: Healthy weight gain takes time, around 0.25–0.5 kg per week
Disclaimer: This article is for informational purposes only and does not constitute medical advice. BMI is a screening tool, not a diagnostic measure. Individual health depends on many factors beyond BMI. Consult a healthcare professional for personalised guidance.
Frequently Asked Questions
What is a healthy BMI for a woman?
Between 18.5–24.9. Below 18.5 is underweight, 25–29.9 overweight, 30+ obese. BMI does not account for muscle mass or body composition, so use it as a screening tool alongside other metrics like waist circumference and body fat percentage.
How do I calculate BMI in kg and cm?
BMI = weight (kg) ÷ [height (cm) ÷ 100]². Example: 65 kg, 165 cm: 65 ÷ (1.65 × 1.65) = 23.9. Or use our free BMI Calculator for an instant result.
Does BMI change with age for women?
The formula does not change, but research suggests BMI 23–27 may be protective for women over 65. Body composition shifts with age as muscle mass decreases and fat distribution changes, making BMI less reliable as a sole health indicator.
What BMI is overweight for a woman?
25.0–29.9 is classified as overweight. If you strength train, you may be in this range while still being healthy. Consider waist circumference and body fat percentage too before drawing conclusions.
Is BMI accurate for women?
It is a screening tool with limitations. It does not account for muscle mass, pregnancy, hormonal changes, or fat distribution differences. Women who are athletic, pregnant, or going through menopause should use additional metrics for a complete picture.
What is the ideal BMI for a 5'4 woman?
Healthy BMI 18.5–24.9 means 108–145 lbs (49–66 kg) for a 5'4" (163 cm) woman. Optimal is around BMI 21–22, approximately 122–128 lbs (55–58 kg).
How much should a 160cm woman weigh?
With a healthy BMI: 47–64 kg (104–141 lbs). The exact ideal weight depends on your frame size, muscle mass, and age. Use our Ideal Weight Calculator for a personalised range.
What is BMI 25 in kg for a 170cm woman?
72.3 kg (159 lbs). This is the overweight threshold for a 170 cm woman. Stay below 72.3 kg to remain in the healthy BMI range. Calculation: 25 × (1.70 × 1.70) = 72.25 kg.
Why is my BMI high but I look normal?
BMI does not distinguish muscle from fat. Regular exercisers with more muscle mass get a higher BMI despite having healthy body fat levels. If you work out regularly, check your body fat percentage instead for a more accurate assessment.
How often should I check my BMI?
Every 1–3 months is sufficient. Focus on trends over time, not daily or weekly changes. Track other metrics too, such as waist circumference, how your clothes fit, and your energy levels.